
Burnham’s biggest problem: ungrateful voters
Few of us believe we benefit from our contract with the state

The trees can wait. Let us first inspect the wood. If Andy Burnham is to succeed as prime minister, he needs not just individual policies that work but an overall story that revives public confidence in politics itself.
In his first speech as prime minister, Burnham promised to:
“change politics, to make it more collaborative, more about problem-solving than point-scoring. We will take power out of here and carry it into every postcode in the land so that they can do more.… Let’s build a new national sense of unity, of common purpose and positivity.”
At the core of this ambition is Burnham’s belief in the ability of a well-run government to improve people’s lives. It is this faith in politics and the role of the state that gives progressives their distinctive purpose.
Here is Burnham’s fundamental problem. He has arrived in Downing Street at a time when few voters share that faith. Most need persuading that politics currently works for them. This post sets out the evidence for the size of his challenge.
Let us start with the story told by official statistics.
Tucked away unnoticed among the hundreds of detailed tables produced by the Office for National Statistics is table 16, of 40 tables, in a file entitled “Effects of taxes and benefits on household income”. (My thanks to ONS staff for guiding me to it.) It shows how many people live in households that receive more in benefits than they pay in taxes. It covers by no means all the public spending that contributes to our “common purpose”, but it tells an important part of the story: the extent to which our political leaders abide by the ethic, “from each according to their means, to each according to their needs.”
Net beneficiaries are now most of us: 53 per cent of the whole population. Leaving aside the Covid years, it’s the highest ever proportion. Back in 1977 (the first year in the ONS series), the figure was just 37 per cent.
For those who have retired, the proportion is 90 per cent, a figure that has fluctuated around that level over the past half century.
The big change has been among those who are not retired. It was just under 30 per cent in 1977. It oscillated in the Thatcher and Major years: up when unemployment was highest, down when unemployment fell. The Blair/Brown era saw a sustained big rise in the number of net beneficiaries, from 33 to 45 per cent over 13 years. The latest figure, for 2023/4, is 46 per cent.
Before we proceed, let us be clear about what the ONS counts.
** “Taxes” cover all direct taxes, such as income tax, national insurance and council tax, and indirect taxes such as VAT, alcohol, tobacco and petrol duty, betting, insurance and airline taxes, and television licences.
** “Benefits” include cash transfers, such as state pensions, universal credit, PIPs and child benefit; and non-cash benefits such as the NHS, social care, education and transport fare subsidies (Collective benefits, such as police and the armed forces, are NOT included,).
That’s the complex reality. Now to the polling evidence – how well we feel the whole system works. I doubt that many of us have even a rough idea of our own totals on each side of the ledger, let alone the net figure. It’s precisely the kind of issue for which it’s worth turning to the wisdom of crowds. This enables us to measure the broad sense of how the public view our contract with the state and its impact on our lives. The poll below provides a glimpse of the public mood. It shows that Burnham has a big problem.
Opinium recently put this question to 2,000 people:
Q. Thinking about taxes you pay and the public services you use (such as the NHS and transport) or benefits you receive, how would you describe the overall balance?
This is what Opinium found:
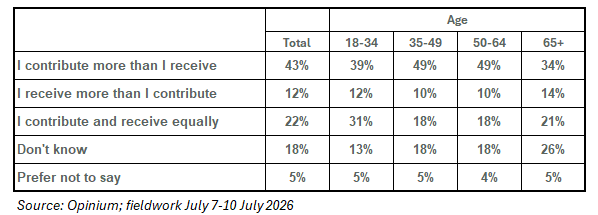
We should not be in the least surprised that so many people don’t take sides. Nevertheless, two things should worry Burnham. The first is the imbalance among those who do take sides. Only 12 per cent say they received more than they pay in, while almost four times as many said they paid out more than they received.
The second is that so few of the over-65s realise that they are net beneficiaries: just 14 per cent, compared with the ONS’s calculation that the true figure is 90 per cent. The gulf between views and perception is often wide. Bobby Duffy, a pollster-turned-academic, has written an excellent book on popular misperceptions in many aspects of modern life. But I reckon the gulf between 14 and 90 per cent is the widest yet.
Plainly, individual circumstances vary. Some healthy older people with large pensions contribute more than they receive. However, their numbers are small. According to other ONS data, pensioners are net beneficiaries in every significant income group. Even the pensioner households in the top ten per cent, on an average annual income of almost £70,000, receive an average of almost £5,000 more in benefits than they pay in taxes.
If we count only cash benefits and exclude “benefits in kind” such as health care, then the richest ten per cent of pensioners do tip into the net contributor group – but only the richest ten per cent. In every other group, cash benefits alone exceed the total of both direct and indirect taxes. All in all, it’s bad news for any of the architects of the triple lock who expected their generosity to be recognised these days by the recipients.
Another way to assess the public mood is to compare views by household income. The tax-and-benefits system is designed to be redistributive. These are Opinium’s figures analysed by income:
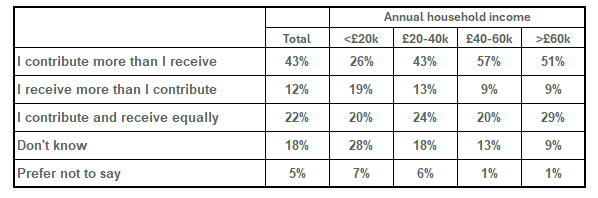
The figures do vary – but even among the poorest group, more people say they are net contributors than net beneficiaries.
Unfortunately, the ONS does not say how many people in each income group are in fact net beneficiaries of the tax-and-benefits system. But it does say how the average household in each group fares. In the poorest 20 per cent, households gain more than £20,000 a year in benefits than they pay in taxes. Yet in Opinium’s sample just 19 per cent of the poorest group say they are net beneficiaries.
Overall, the message for Burnham is bleak. It’s not just that our contract with the state is widely misunderstood. It is that even the groups whose living standards are most clearly boosted by cash and other benefits do not immediately associate this with a political process designed to help them.
This is not just a one-off result from this particular poll: other surveys down the years, testing the matter with differently worded questions, have produced similar findings. (YouGov explored the issue during the Cameron government’s austerity years.) In 2022, the OECD tested views in a different way. Instead of asking about the relation between taxes and benefits, it posed a question about fairness. It asked 18-64 year-olds in 27 countries whether they agreed or disagreed with the statement: “I feel that I receive a fair share of public benefits, given the taxes and social contributions I pay and/or have paid in the past”.
It found that just 26 per cent of UK respondents agreed. The other 74 per cent did not: 41 per cent disagreed, while the other 33 per cent said “neither” or “don’t know”. The UK was in the middle of the pack – more content than France or Portugal, less than Norway or Denmark. A Labour government should be more ambitious than for Britain to be mid-table.
Part of the explanation for all this might flow from a widespread belief that too much of the taxes we pay is diverted to the wrong people. For the past seven years, YouGov has been tracking attitudes to recipients of welfare benefits. In June 2019, 53 per cent thought most of them were “genuinely in need”, while 36 per cent thought the share in need was half or less. Just this week, YouGov has published its latest figures. There has been a marked, 12-point, swing since 2019. The number who now think most welfare recipients deserve their help has fallen to 41 per cent, while the half-or-less figure has risen to 48 per cent. Voters think a bad problem is getting worse.
It’s clear that Burnham needs to revive faith in politics, and to overcome voters’ habit of scepticism and ingratitude. This week’s early measures, such as scrapping VAT on electricity bills and capping bus fares at £2, are modest first steps. A long journey lies ahead. With money short, his powers of finding the right policies and telling compelling stories right will face severe tests.
One final point. This post has been compiled from different bits of data gathered in different ways at different times. I should have liked to paint a more comprehensive picture – and for ONS to have filled in the gaps in data showing the number of net beneficiaries by age, income and family circumstances. (Opinium’s data suggest, but do not absolutely prove, that parents tend to ignore the spending on their children’s education when judging whether they are net beneficiaries in their dealings with the state. This alone is worth investigating further.)
I don’t think I have ever adopted the conclusion that social scientists commonly offer when discussing their work: “more research is needed”. On this occasion it is true: if Burnham’s premiership is to succeed, we need to understand the gulf between perception and reality far better: above all, WHY is it so wide? Then we might be able to work out whether Burnham’s government can close it, and if so how.
Most pensioners are likely to deny their old age pension is a benefit. They would assert they have paid in for it. The wilful misunderstanding we British go in for. What would be interesting would be lifetime figures. That would show if I had indeed paid for my pension and if my net lifetime contribution was positive or negative.
I am surprised there aren't far more people in the "Don't know" bracket, considering the complexity of the question: how does anyone know the balance between ALL benefits received, and ALL taxes paid, by themelves?
We never see a "State benefit" price tag on a "free" NHS GP appointment, or for vaccination by a nurse. Who knows what a subsidy on bus fares might be--unless it's a Burnham campaign. What is the cost of your child's state education?
Whereas people are all too aware of figures on a PAYE slip, and 20% VAT on most consumer goods, including fuel duty.
I dimly remember seeing a board up in some hospital waiting area, that stated the cost to the hospital of last-minute cancellations and missed appointments. But not very convincing, or why were there still such long waiting times despite people not turning up? Surely they'd already figured no-shows into the appointments system.
And even were it true, it seemed a bit pointless after the event: a plea to regular outpatients perhaps, if they saw the board often enough. But for individual impact it needed to state cost-per-missed-appointment in wasted specialist time. A global amount for total missed appointments was too abstract.
Perhaps Burnham needs an individually-focused awareness campaign with a lot of state benefit price tags, to wake up ignorant and ungrateful voters to the reality of redistributive state largesse. It might still not feel like enough, but at least perception might match reality.